

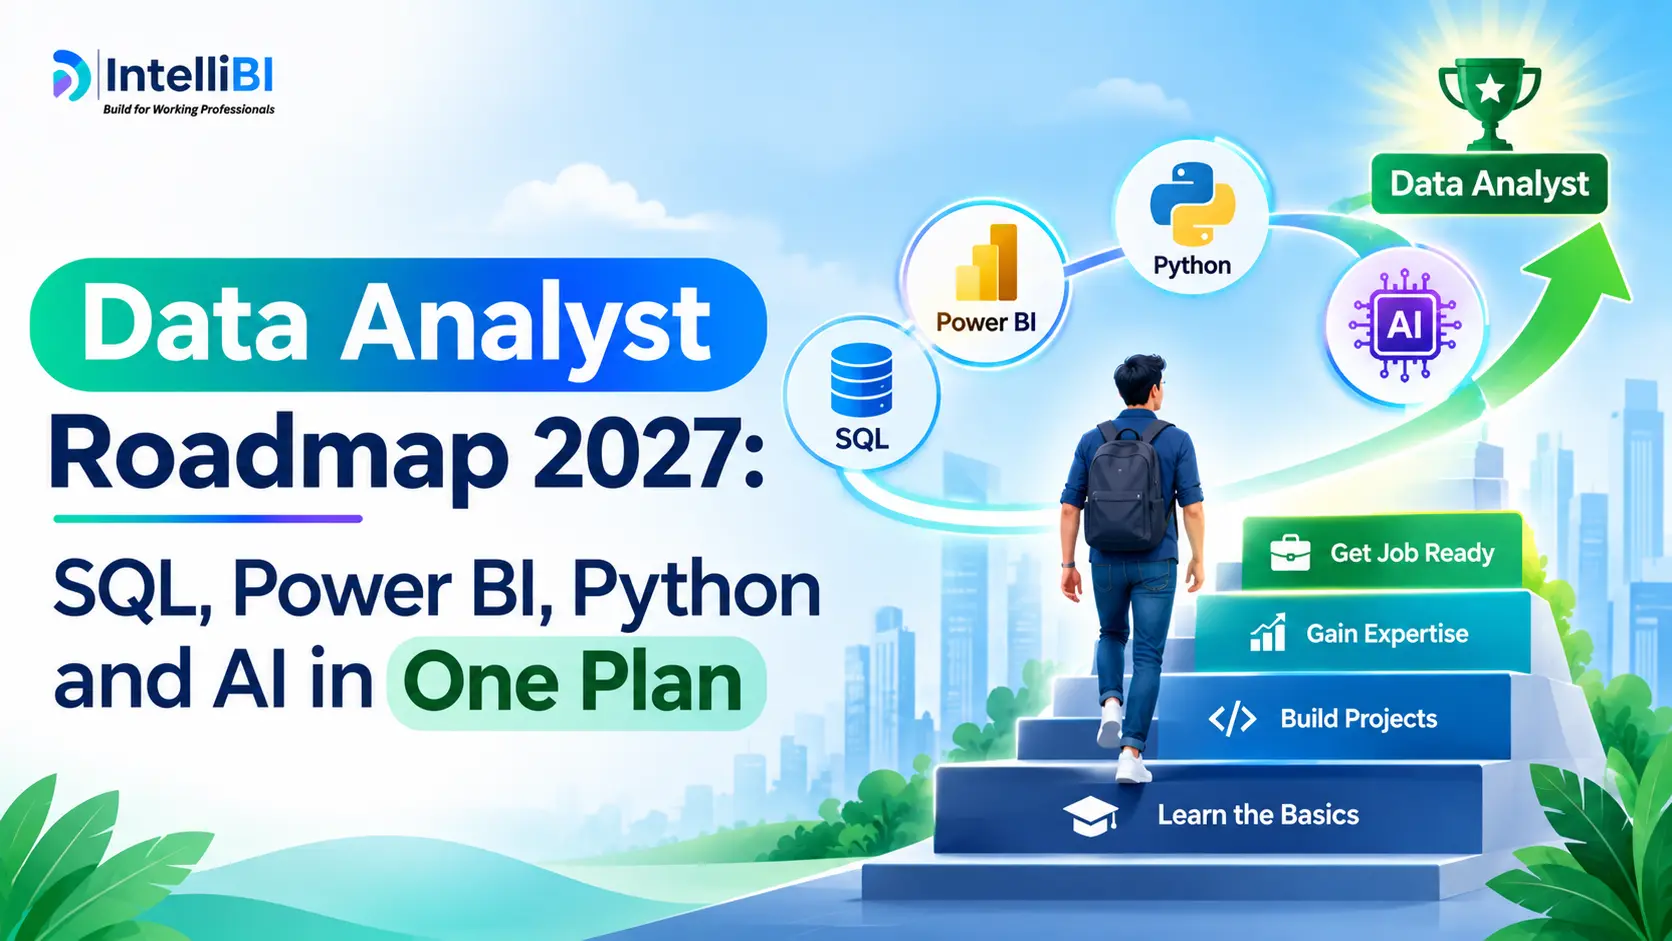
Data Analyst Roadmap 2027: SQL, Power BI, Python and AI in One Plan
Quick Answer
A practical Data Analyst Roadmap for 2027 starts with Excel, statistics and SQL, followed by data cleaning, Power BI, Python and AI-assisted analytics. Build projects that demonstrate data retrieval, dashboard development and business analysis. A structured six-month plan can help organise learning, but consistent practice and project experience are essential.
Data analytics is becoming an important part of business decision-making. Companies across industries use data to understand customer behaviour, monitor performance, identify problems and plan future strategies. As businesses generate more information, they need professionals who can convert raw data into meaningful insights.
Knowing Excel and creating basic reports is no longer enough to stand out. Employers increasingly value professionals who can work with databases, build interactive dashboards, automate analysis and use Artificial Intelligence (AI) tools responsibly.
If you want to enter the analytics field or upgrade your existing skills, following a structured learning plan can make the process easier. This Data Analyst Roadmap 2027 explains how to learn SQL, Power BI, Python and AI step by step, with practical projects and a six-month learning plan.
Whether you are a fresher, graduate, working professional or someone planning a career change, this roadmap will help you understand what to learn and how to practise it.
What Does a Data Analyst Need to Know in 2027?
A Data Analyst collects, cleans, examines and interprets information to help organisations make informed decisions. The work involves understanding business requirements, identifying useful data, analysing patterns and communicating findings.
For example, an e-commerce company may want to understand why sales have decreased. A Data Analyst can examine sales records, customer activity, product performance and regional trends to identify possible reasons.
To perform these responsibilities, aspiring analysts should develop the following skills:
- Data handling: Understanding how to collect, organise and clean information.
- SQL: Retrieving and analysing data stored in relational databases.
- Excel: Performing calculations, organising information and preparing reports.
- Power BI: Creating dashboards and presenting business insights visually.
- Python: Automating repetitive tasks and performing advanced data analysis.
- Statistics: Understanding averages, distributions, trends and relationships.
- AI tools: Using AI to support analysis, generate ideas and improve productivity.
- Communication: Explaining findings clearly to business teams and decision-makers.
The best approach is to understand the fundamentals first and gradually move towards more advanced applications.
Step 1: Build Your Foundation with Excel and Statistics
Before learning advanced analytics tools, understand how data works.
Excel is a useful starting point because it introduces spreadsheet operations, calculations, data organisation and basic reporting. It also helps you understand how businesses work with structured information.
Start by learning:
- Worksheets, rows, columns and cell references.
- Sorting and filtering data.
- Conditional formatting.
- Data validation.
- Formulas such as SUM, AVERAGE, COUNT and IF.
- Lookup functions such as XLOOKUP and VLOOKUP.
- Pivot Tables and Pivot Charts.
- Basic data cleaning techniques.
Along with Excel, develop a basic understanding of statistics. Learn mean, median, mode, percentages, standard deviation, correlation and basic probability.
These concepts help you interpret information correctly. For instance, an average sales value may not represent the typical customer purchase if a few unusually large transactions affect the result.
Practice task: Download a sample sales dataset and calculate total revenue, average order value, monthly sales and top-performing products. Use Pivot Tables to identify patterns.
Step 2: Learn SQL for Database Analysis
SQL is one of the most important technical skills for a Data Analyst. Organisations store large amounts of information in databases, and SQL helps analysts retrieve the specific records required for analysis.
Instead of manually examining thousands of spreadsheet rows, you can write queries to filter, combine and summarise data.
Start with the fundamentals:
- Introduction to databases and relational tables.
- SELECT and FROM statements.
- WHERE conditions.
- ORDER BY and DISTINCT.
- LIMIT and filtering records.
- Aggregate functions such as SUM, COUNT, AVG, MIN and MAX.
- GROUP BY and HAVING.
- INNER JOIN, LEFT JOIN, RIGHT JOIN and FULL JOIN.
- Subqueries and Common Table Expressions (CTEs).
- CASE statements.
Once you understand these concepts, practise writing queries using business datasets.
For example, consider a sales database containing customer orders. You can use SQL to identify the total revenue generated by each product category.
SELECT
product_category,
SUM(sales_amount) AS total_revenue
FROM sales
GROUP BY product_category
ORDER BY total_revenue DESC;
This query groups transactions by product category, calculates total revenue and displays the categories in descending order.
Do not limit your learning to memorising SQL commands. Understand why a query is written in a particular way and how the result answers a business question.
Practice task: Create a small sales database and write queries to identify monthly revenue, repeat customers, top-selling products and regional performance.
Step 3: Understand Data Cleaning and Preparation
Raw data is rarely ready for analysis. It may contain duplicate records, missing values, inconsistent formats, spelling mistakes and incorrect entries.
Data cleaning is therefore an essential part of an analyst's daily work.
Learn how to:
- Identify and remove duplicate records.
- Handle missing and null values.
- Correct inconsistent date formats.
- Standardise text and category names.
- Identify unusual values.
- Validate records against business rules.
- Check whether data is complete and consistent.
For example, a customer dataset may contain the same city written as "Pune", "PUNE" and "pune". These values should be standardised before analysing customer locations.
You should also learn to distinguish between correcting an error and changing a valid but unusual observation. Removing data without understanding its meaning can lead to incorrect conclusions.
Learning to prepare data across multiple tools will make you more confident when handling real business requirements.
Step 4: Master Power BI for Business Reporting
Power BI is a widely used business intelligence platform that helps analysts convert datasets into interactive reports and dashboards.
A Data Analyst should understand how to connect different data sources, prepare information, build data models and create meaningful visualisations.
If you are exploring a Power BI Course in Pune, make sure the learning path includes practical work rather than only chart creation.
Focus on the following areas:
Power BI Desktop Fundamentals
Understand the Power BI interface, report view, data view and model view. Learn how to import data from Excel, CSV files, databases and other supported sources.
Power Query
Power Query is used to connect to data sources and transform information before loading it into a report. Learn how to remove unnecessary columns, filter rows, replace values, split columns and combine datasets.
Data Modelling
Learn how tables are connected through relationships. Understand primary keys, foreign keys, fact tables, dimension tables and star schema concepts.
A well-designed data model makes reports easier to maintain and calculations more reliable.
DAX
Data Analysis Expressions (DAX) is used to create calculations in Power BI.
Begin with calculated columns and measures. Then practise functions such as SUM, COUNTROWS, CALCULATE, FILTER, DISTINCTCOUNT and time intelligence functions.
Data Visualisation
Learn when to use bar charts, line charts, cards, tables, maps and other visuals. Select visualisations based on the question you want to answer instead of adding charts simply to make a dashboard look attractive.
Dashboard Design
A useful dashboard should communicate important information quickly. Use appropriate labels, consistent formatting, meaningful filters and clear navigation.
For example, a retail sales dashboard can include:
- Total sales and profit.
- Monthly revenue trends.
- Top-performing products.
- Regional sales performance.
- Customer segments.
- Year-over-year comparisons.
The objective is to help a business user understand performance and identify areas that need attention.
Practice task: Build a complete sales performance dashboard using a sample dataset. Include interactive filters, DAX measures and a short explanation of the business insights.
Step 5: Learn Python for Advanced Data Analysis
Python is useful when datasets become larger, repetitive analysis needs automation or more advanced data manipulation is required.
You do not need to become a software developer to use Python as a Data Analyst. Focus on the programming concepts and libraries that support data analysis.
Start with Python fundamentals:
- Variables and data types.
- Lists, tuples, dictionaries and sets.
- Conditional statements.
- Loops.
- Functions.
- File handling.
- Exception handling.
- Basic object-oriented programming concepts.
After learning the basics, move to data analysis libraries.
Pandas
Pandas helps you work with structured datasets. Learn how to read CSV and Excel files, inspect DataFrames, filter records, handle missing values, group data and perform aggregations.
NumPy
NumPy supports numerical calculations and array-based operations. It is useful for working with numerical datasets.
Matplotlib and Seaborn
These libraries help create visualisations such as bar charts, line charts, histograms, scatter plots and distribution plots.
Jupyter Notebook
Jupyter Notebook provides an interactive environment where you can write code, examine results and document your analysis.
For example, you can use Pandas to calculate average sales from a CSV file:
import pandas as pd
data = pd.read_csv("sales.csv")
average_sales = data["sales_amount"].mean()
print("Average Sales:", average_sales)
This code reads a sales dataset and calculates the average value of the sales amount column.
Practice task: Analyse a customer dataset using Pandas. Clean missing values, identify customer segments and create visualisations showing purchasing patterns.
Step 6: Understand How AI Is Changing Data Analytics
Artificial Intelligence is becoming an additional productivity tool for analytics professionals. It can support tasks such as writing queries, explaining code, exploring patterns and preparing summaries.
However, AI should support analytical thinking rather than replace it.
A Data Analyst should understand how to use AI tools effectively and verify their outputs before presenting results.
Important areas to explore include:
AI-Assisted SQL
AI tools can help generate SQL queries from natural-language instructions. For example, you can describe a requirement such as "Find the top five products by revenue" and ask an AI assistant to suggest a query.
You should still check table names, joins, filters and calculations before using the result.
AI-Assisted Python
AI can help explain Python errors, suggest code improvements and generate initial scripts for repetitive tasks. Analysts must test the code and confirm that it produces the expected output.
Data Exploration
AI tools can help summarise datasets, suggest possible relationships and generate questions for further investigation. These suggestions should be validated using actual data.
AI in Business Intelligence
Some business intelligence platforms offer AI-assisted capabilities for exploring data, generating summaries and supporting report development. Availability can depend on the product, licensing, organisation settings and technical requirements.
Prompt Engineering
Learn to write clear instructions that provide the required context, expected output and relevant constraints.
For example, instead of asking an AI tool to "analyse sales", provide details about the dataset, the business objective and the metrics you want examined.
Data Privacy and Accuracy
Never upload confidential company or customer information into an AI tool without appropriate authorisation. Always verify calculations, sources and generated conclusions.
A strong analyst understands both the benefits and limitations of AI.
A Practical Six-Month Data Analyst Learning Roadmap for 2027
A structured learning schedule can help you move from basic concepts to practical analytics work. The following six-month plan is a suggested sequence. You can adjust the pace depending on your existing knowledge and available study time.
Month 1: Excel, Statistics and SQL Fundamentals
Begin with spreadsheet operations and basic statistics. Understand how datasets are structured and how to calculate common business metrics.
Then start SQL with SELECT, WHERE, ORDER BY, GROUP BY and aggregate functions.
By the end of this month, you should be able to organise data in Excel and write basic SQL queries.
Month 2: Advanced SQL and Data Cleaning
Move towards joins, subqueries, CTEs, CASE statements and window functions.
Practise handling duplicate records, missing values and inconsistent formats. Work with datasets that contain multiple related tables.
By the end of this month, you should be able to retrieve and prepare data for business analysis.
Month 3: Power BI Fundamentals
Learn how to import datasets, use Power Query, create relationships and design reports.
Start working with basic DAX measures and commonly used visualisations.
Build your first interactive dashboard using a sales or customer dataset.
Month 4: Advanced Power BI and Python
Improve your data modelling and DAX skills. Explore dashboard performance, report navigation and time-based calculations.
Start Python programming and practise working with Pandas, NumPy and visualisation libraries.
By the end of this month, you should be able to perform analysis using both Power BI and Python.
Month 5: AI-Assisted Analytics
Explore AI tools that support SQL, Python, data exploration and reporting.
Practise writing prompts, checking generated code and interpreting AI-assisted summaries.
Focus on understanding how AI can improve productivity without compromising data accuracy or privacy.
Month 6: Projects and Interview Preparation
Use the final month to combine your skills in practical projects.
Prepare a portfolio containing SQL analysis, Power BI dashboards and Python-based data exploration.
Practise explaining your approach, business findings and recommendations. Review common technical interview questions and work on communicating your results clearly.
By following this sequence consistently, you can build a foundation for entry-level analytics responsibilities. Your actual progress will depend on practice time, previous experience and the complexity of the projects you complete.
Three Practical Projects to Build Your Data Analyst Portfolio
Completing projects is important because it demonstrates how you apply technical skills to business problems. Instead of displaying only certificates, prepare projects that explain the problem, your approach and the outcome of your analysis.
Project 1: Retail Sales Analysis Using SQL
Create a sales dataset containing order details, product categories, customer information, transaction dates and revenue.
Use SQL to answer questions such as:
- Which product categories generate the highest revenue?
- Which months have the strongest sales?
- Which customers place repeat orders?
- Which regions contribute the most revenue?
- Are there products with declining sales?
Include your SQL queries and a short explanation of the findings.
Project 2: Business Performance Dashboard Using Power BI
Use a sales or operations dataset to create an interactive dashboard.
Include key performance indicators, monthly trends, category-level comparisons and regional performance.
Use Power Query for data preparation, relationships for data modelling and DAX measures for calculations.
Your project should explain how a manager can use the dashboard to monitor business performance.
Project 3: Customer Analysis Using Python and AI
Work with a customer dataset containing purchase history, customer categories and transaction details.
Use Pandas to clean and explore the data. Apply visualisation libraries to identify trends and customer segments.
You can use an AI assistant to suggest analytical questions or explain code, but validate every calculation and conclusion yourself.
Document the business problem, cleaning steps, analysis process and recommendations.
Data Analyst vs Business Analyst: What Is the Difference?
Data Analysts and Business Analysts both support business decisions, but their responsibilities can differ.
A Data Analyst generally works with datasets, databases, statistical methods and reporting tools. The focus is on finding patterns, measuring performance and presenting insights.
A Business Analyst generally focuses on business requirements, processes, stakeholder communication and identifying opportunities for improvement. The role may involve documenting requirements, understanding workflows and coordinating with technical teams.
There can be overlap between the two roles. Some organisations expect Business Analysts to work with SQL and dashboards, while some Data Analysts participate in requirement discussions and business planning.
If you enjoy working with datasets, SQL, Python and dashboards, Data Analytics may be a suitable direction. If you prefer understanding business processes, gathering requirements and coordinating solutions, Business Analysis may be worth exploring.
How to Prepare for Data Analyst Interviews in 2027
Technical knowledge is only one part of interview preparation. Employers may also evaluate how you approach problems and communicate your findings.
Prepare in the following areas:
- SQL practice: Solve questions involving joins, grouping, subqueries and window functions.
- Excel: Revise formulas, lookup functions, Pivot Tables and data cleaning.
- Power BI: Explain data modelling, relationships, DAX and dashboard design.
- Python: Practise DataFrame operations, filtering, grouping and handling missing values.
- Statistics: Understand averages, distributions, correlation and basic probability.
- Projects: Be ready to explain the business problem, data source, methodology and conclusions.
- Communication: Practise explaining technical findings in simple business language.
When discussing a project, do not simply describe the tools you used. Explain why you selected a particular approach and how the analysis helped answer the business question.
How to Choose the Right Data Analytics Learning Path
Choosing a learning programme requires more than comparing course names. Look at the curriculum, practical exercises, trainer experience and project opportunities.
Before enrolling in a programme, check whether it covers:
- Excel and essential statistical concepts.
- SQL from beginner to advanced levels.
- Power BI, Power Query and DAX.
- Python for data analysis.
- Data cleaning and data modelling.
- AI-assisted analytics and responsible AI usage.
- Practical projects based on business scenarios.
- Interview preparation and portfolio development.
If you are comparing a Data Analyst Course in Pune with Placement, carefully verify what placement assistance actually includes. Ask about interview preparation, employer connections, placement eligibility and the support provided after course completion. Do not assume that placement assistance guarantees a job.
Working professionals should also consider class timings, practical learning support and the flexibility to complete assignments alongside their current responsibilities.
A suitable programme should help you understand concepts, practise independently and build the confidence to solve business problems.
Frequently Asked Questions
1. What should I learn first to become a Data Analyst in 2027?
Start with Excel, basic statistics and SQL. These subjects help you understand data and perform basic analysis. Once you are comfortable, move to Power BI and Python.
2. Is SQL necessary for Data Analysts?
Yes. SQL is an important skill because many organisations store business information in relational databases. Analysts use SQL to retrieve, filter, combine and summarise records.
3. Is Power BI enough to become a Data Analyst?
Power BI is useful for reporting and visualisation, but it is not enough on its own for most well-rounded analytics roles. You should also learn SQL, data cleaning, Excel and basic statistics. Python can further strengthen your analytical capabilities.
4. Should I learn Python or Power BI first?
For many beginners, learning Power BI after Excel and SQL provides a practical introduction to business reporting. Python can follow once you understand data preparation and basic analysis. However, the best sequence depends on your career goals and the requirements of the roles you are targeting.
5. Can a fresher become a Data Analyst?
Yes. Freshers can prepare for entry-level opportunities by learning core analytics tools, practising with datasets and building a portfolio of relevant projects. Strong fundamentals and the ability to explain analytical decisions are important.
6. Can I become a Data Analyst without a programming background?
Yes. You can begin with Excel, statistics and SQL. Python can be learned gradually. Consistent practice is more important than having a previous programming background.
7. How long does it take to learn Data Analytics?
The learning period depends on your starting knowledge, study schedule and practice. A structured six-month plan can help build foundational skills, but becoming job-ready may require additional project work and interview preparation.
8. How is AI used in Data Analytics?
AI can assist with SQL generation, code explanations, data exploration, summaries and report development. Analysts must verify outputs, protect confidential information and use business context before making decisions.
9. What projects should a beginner Data Analyst complete?
Start with a retail sales analysis using SQL, an interactive Power BI dashboard and a customer analysis project using Python. These projects demonstrate different parts of the analytics workflow.
10. What is the difference between a Data Analyst and a Business Analyst?
A Data Analyst mainly examines datasets and communicates insights. A Business Analyst focuses more on business requirements, processes and solutions. Responsibilities can overlap depending on the organisation.
Conclusion
The Data Analyst role in 2027 requires a combination of technical knowledge, business understanding and analytical thinking. Excel and statistics provide the foundation, SQL helps retrieve information, Power BI makes insights easier to understand, and Python supports deeper analysis and automation. AI adds another layer of productivity when used responsibly.
The most effective way to learn is to combine concepts with practical work. Follow a structured roadmap, practise with real-world datasets and build projects that demonstrate your ability to solve business problems.
If you want structured guidance while developing these skills, explore the Data Analyst Training in Pune offered by IntelliBI Innovations Technologies. Focus on building practical knowledge, working on projects and preparing for the responsibilities expected in analytics roles.