Transform Data into Impactful Insights with Tableau
Master Dashboard Creation, Trend Analysis, and Data Storytelling with Practical Skills for Real-World Success
Learning Format
Online Mode
Total Training Duration
200 Hrs
Duration
4 Month
Certification
Yes
Tableau Course in PCMC Pune
Unlock the power of data visualization with IntelliBI Innovations & Technologies’ Tableau Course in PCMC Pune — designed for students, working professionals, and aspiring data analysts who want to build a strong foundation in business intelligence.
Our Tableau Classes focus on hands-on learning with real-world projects, helping you master every stage of data analysis — from connecting and cleaning data to creating interactive dashboards. You’ll learn to work with multiple data sources, perform drilldowns, sorting, grouping, and clustering, and apply advanced filters, parameters, and interactivity to gain actionable insights.
The course also covers complex calculations including aggregate, date, logical, and string functions — essential for accurate data interpretation. Through guided practice, you’ll explore geographical visualization, storytelling techniques, and dashboard publishing, preparing you to present data-driven stories that make an impact.
By the end of our Tableau Classes in Pune, you’ll not only be able to create powerful visual dashboards but also interpret and communicate insights effectively — a crucial skill for roles in data analytics, business intelligence, and reporting.
Whether you’re a beginner or a professional looking to upgrade your skills, IntelliBI Innovations & Technologies offers a career-focused learning path that helps you stand out in the data-driven world.

The Tableau Course in PCMC Pune is ideal for a wide audience. It is perfect for students who want practical skills in data visualization, business analysts and BI professionals who need hands-on Tableau experience, and developers or data engineers who want to strengthen their toolkit with visualization skills. It also suits anyone preparing for Tableau certification or aspiring to transition into data-focused roles.
We offer flexible learning formats to meet your needs. You can choose from instructor-led classroom sessions in PCMC Pune or interactive online classes as part of our Online IT Courses in PCMC Pune. Every batch includes live demonstrations, lab sessions, project work, and dedicated time for doubt clearing. As you progress, you will complete real-world projects that can be added to your professional portfolio.
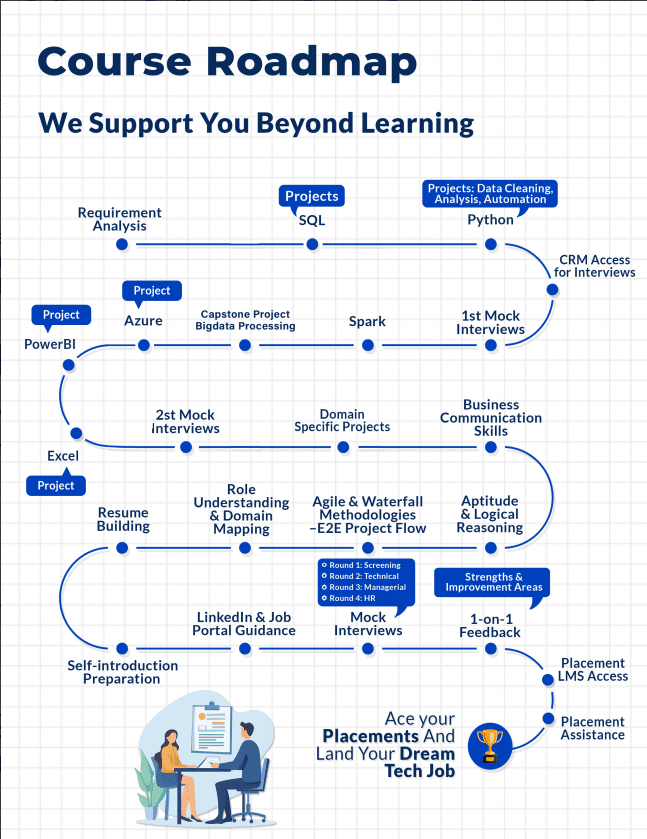
At IntelliBI, the focus is on practical, job-ready training led by industry professionals who share insights from real project experience. The training emphasizes hands-on practice over theory. You will benefit from small batch sizes that allow personal attention, practical assignments along with a capstone project, and resume plus interview guidance aimed at BI roles. Placement assistance and internship opportunities are also part of the support we provide.
By completing this course, you will be able to create comprehensive Tableau dashboards that are ready for stakeholders. You will have the ability to interpret complex datasets and present actionable insights, making you a strong candidate for roles such as Data Analyst, BI Developer, or Reporting Analyst. The course also prepares you to confidently take on Tableau certification exams.
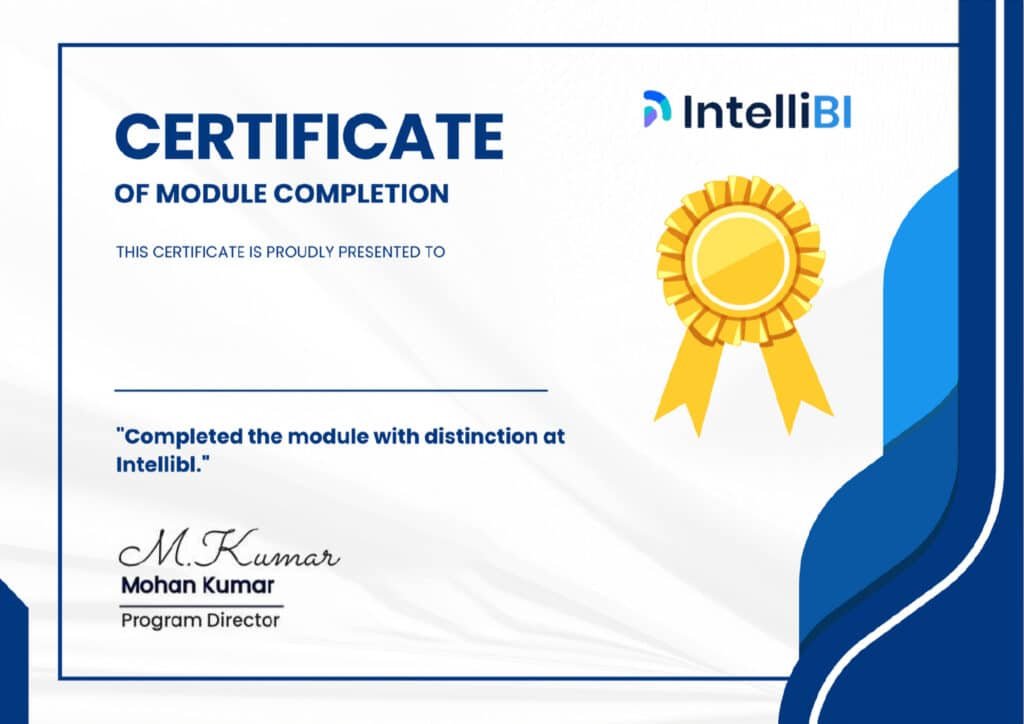
The course is structured with a mix of classroom sessions and lab work. After completion, you will receive a course certificate from IntelliBI that highlights your hands-on learning. In addition, you will get guidance to prepare for official Tableau certification exams.
Join our next batch of the Tableau Course in PCMC Pune or enroll through our Online IT Courses in PCMC Pune. Contact us today to book a free demo class and get a personalized learning plan. Learn the skills employers are hiring for and build a portfolio that opens doors.
Course Summary
Eligibility
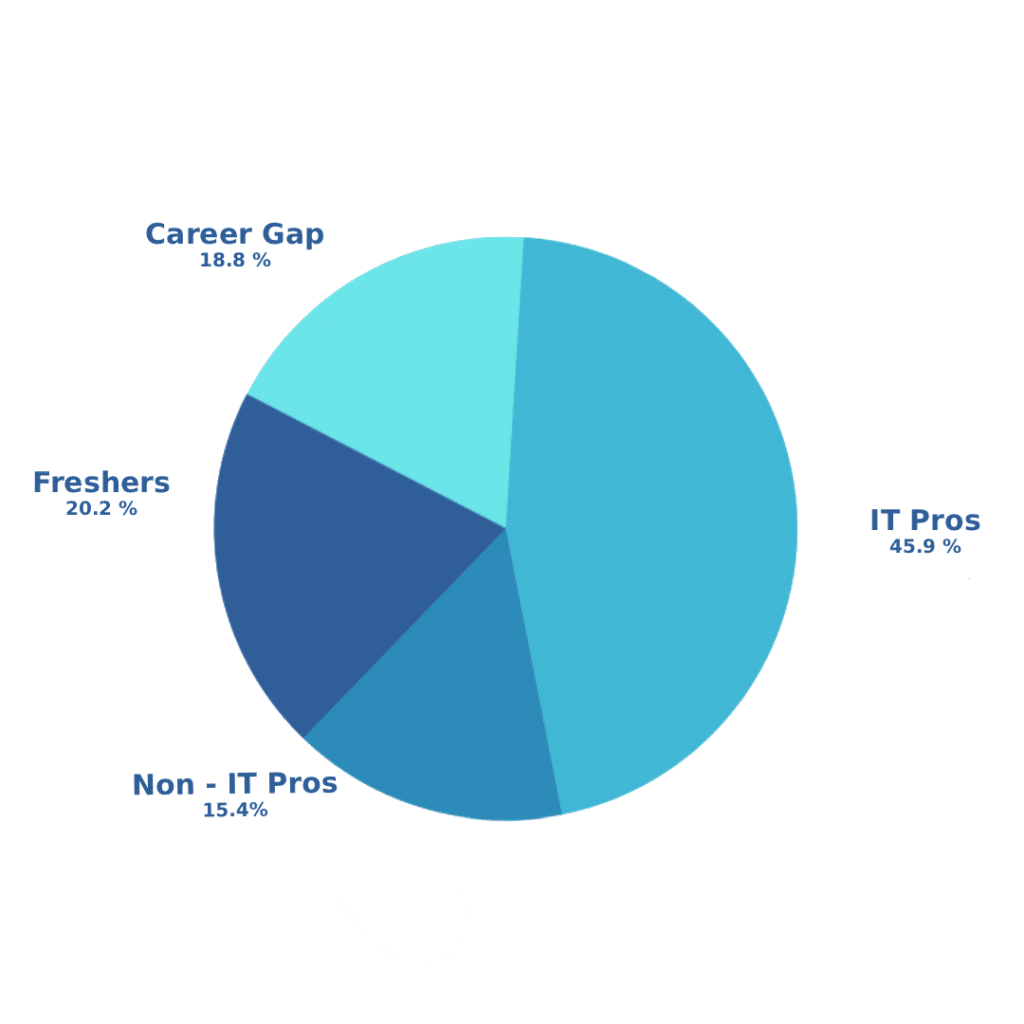
Tech & Non-Tech Working professional, Freshers, Graduate from any domain.
Real time projects
Gain hands-on experience through projects that simulate real-world challenges, preparing you for a career in analytics.
Dedicated Profile Building
Along with learning, we help you with ATS resume building and LinkedIn profile optimization
Hands-on Industry Relevant Casestudies
Complete guidance for 25+ Assignments and case studies to help you gain the hands-on experience.
Live Doubt Solving
Get your queries solved with daily dedicated doubts solving sessions.
800+ Companies
Connect with top employers
Certification
10+ ISO Globally recognized certified
LMS Access for 2 Years
Get course recording access for 2 years after course completion.
Aspirational peer group
10K+ students & alumni across diverse domains. Dedicated Telegram virtual classroom for peer-to-peer support.
Instructor
Experts and trainer for top-tech companies.
Direct CRM Calls
Get shortlisted instantly
GitHub Enhancement
Showcase coding skills
Al Mock
Interviews Practice and improve with Al feedback
Placement Assistance Until Placed
Along with up skilling and preparing you for the job, we also help you for your search & your interview.
Mode of Learning
100% Live Learning Learn directly from experienced instructors in Live sessions, with an emphasis on practical, hands-on learning.
Program Name
LinkedIn Optimization
Program Duration
Eligibility
Real time projects
Dedicated Profile Building
Live Doubt Solving
800+ Companies
Certification
LMS Access for 2 Years
Aspirational peer group
Hands-on Industry Relevant Casestudies
Instructor
Direct CRM Calls
GitHub Enhancement
Al Mock Interviews
Mode of Learning
Placement Assistance Until Placed
Syllabus Summary
A Comprehensive Curriculum Designed for Real-World Success
- Type of Statements, Constraints, Clauses
- Functions, Joins, Subqueries, Set Operators
- Analytical Functions, Pivot/Unpivot, Partitions
- Indexes, Views, Sequences, Synonyms
- Performance Tuning
- Stored Procedure & Stored Function
- Cursors, Exception Handling
- Introduction, Data Types (Tuple, List, Dict, Set)
- Control Statements, User-Defined Functions
- String Operations, File & Error Handling
- NumPy, Pandas
- Visualization: Matplotlib, Seaborn
- Automation & Real-World Cases
- Spark Overview
- Spark Architecture
- Transformations, Actions & Lazy Evaluation
- Series & DataFrame Basics
- Spark SQL
- DataFrame Operations
Filtering & Sorting
Built-in Functions & Case Statements
Aggregations & Grouping
Joins & Window Functions
Set Operators
GlobalTemp Views
Analytic Functions
Reading File Formats
Parquet, CSV, JSON
Nested DataFrames - SCD Type 1 (Slowly Changing Dimension)
- SCD Type 2
- Data Factory, Databricks, Synapse
- Storage, Data Lake, Blob Storage, Lake Storage
- Cosmos DB, Logic Apps, API Management
- Event Hub, loT Hub
- Data visualization using Power BI
- Data Modelling
- Power Query
- Advanced visualizations
- DAX
- Build data analytics project using Power BI
- Basics & Navigation
- Formulas & Functions
- Data Management
- Charts & Visualization
- Advanced Analysis
- Profile Management with GitHub
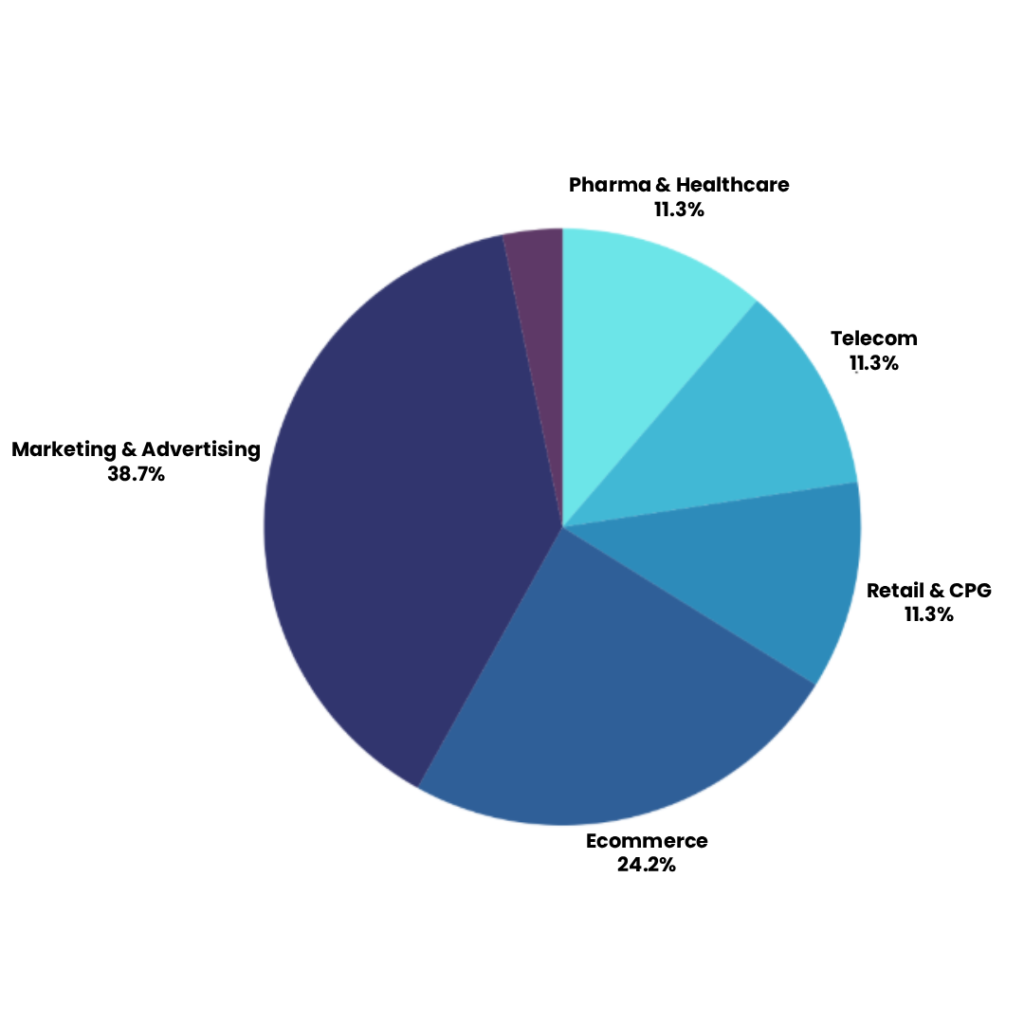
Top Hiring Industries in India for Data Analytics
Career Support Services
Resume Building
Linkedin Optimaztion
Access To Job Board
Interview Calls
GitHub Portfolio
IntelliBI Azure Data Engineering Certification
Course Highlights

- Course Duration
- 250+ Hours /
- 4 Months

-Pre-Class-
-Pre Career Counseling,
-Technical Evaluation

-Sessions- Technical,
-Softskill, Mentor,
-E-Consultation.

-Technical
-Assignments
-300+ Case Studies

-Industry Real
-World Project 4

-Mock Interviews 5

-Student Internship
-Dashboard

-Resume Preparation,
-Interview Guidance
-Job Readiness,
-Placement support
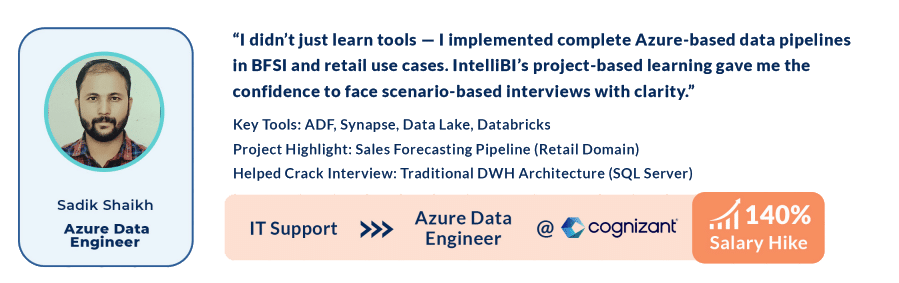
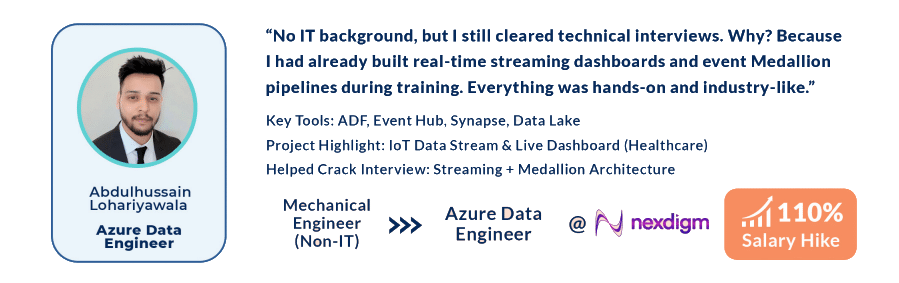
Our Learners Got Assured Placement. So Can You!
Students reviews
Real stories. Real success.
Real students.
[trustindex no-registration=google]
- Why Data Analyst
- Curriculum
1. Why Learning Advanced Data Analyst with Azure & with PowerBI is a Long-Term Investment:
2. Pre-requisites:
- SQL & PL/SQL (Stored Functions, Stored Procedures, Indexes)
- Python
- Spark (PySpark, Spark SQL)
3. Azure Services: A Must for Data Engineers:
- Azure Data Factory
- Azure Databricks
- Azure Synapse
- Azure Storage
- Azure Data Lake
- Azure Blob Storage
- Azure Data Lake Storage
- Azure Cosmos DB
- Azure Logic Apps
- Azure Machine Learning
- Azure API Management
- Azure Event Hub
- Azure IoT Hub
4. PowerBI Services: A Must for BI Developer:
- Power BI Desktop:
- Data Loading & Transformation (Power Query)
- Data Modeling
- Data Visualization
- DAX
- Report Design & Publishing
- Power BI Admin:
- Power BI Workspaces & Collaboration
- Data Refresh & Gateways
- Row-Level Security (RLS)
- Monitoring & Usage Analytics
- Licensing & Permissions
- Data Ingestion End-to-End Pipeline and Visualization: Using Azure Storage (e.g., Azure SQL): The final table/files created by the Data Engineer will serve as the source for Power BI.
- Data Ingestion End-to-End Pipeline and Visualization: Using File Storage and Synapse Views: The final table/files created by the Data Engineer will serve as the source for Power BI.
5. Comparing Coding Complexity: Advance Data Analysts vs Java Developers
6. Career Opportunities
- For Experienced Professionals:
- Azure Data Engineer
- Cloud Data Engineer
- Big Data Engineer
- Data Analyst
- Business Intelligence (BI) Developer
- Cloud Solutions Architect
- Data Analyst
- Azure Data Engineer + Power BI Specialist
- Power BI Developer
- Cloud ETL Developer
- For Freshers:
- SQL Developer
- PLSQL Developer
- Python Developer
- Pyspark developer
- Big Data Engineer
- Azure Data Engineer
- Cloud Data Engineer
- Data Analyst
- Azure Data Engineer + Power BI Specialist
- Business Intelligence(BI) Developer
- PowerBI Developer
- Cloud ETL Developer
7. Job Opening:
8. Eligibility Criteria:
- Eligible Degrees:
- BE (all streams)
- B.Tech
- BCS
- BCA
- B.Com
- BBA
- Other related technical or non-technical bachelor’s fields
- And its relevant postgraduate degrees
- Diploma Holders:
- All streams may also be eligible.
- Communication Skills:
- Basic written and verbal communication skills.
- Ability to explain technical concepts clearly.
9. The Future of Data Engineering with Azure:
10. Annual CTC for Data Analysts With Azure and Power BI. (Based on Experience):
- 0-1 Year Experience (Entry-Level):
- India: ₹4–6 LPA
- US: $60,000–$80,000
- 1-4 Years Experience (Junior/Mid-Level):
- India: ₹6–14 LPA
- US: $80,000–$110,000
- 4-8 Years Experience (Mid-Level/Senior):
- India: ₹10–25 LPA
- US: $110,000–$140,000
- 4.8+ Years Experience (Senior/Lead):
- India: ₹20–55+ LPA
- US: $140,000–$160,000+
Summary:
Pre-requisites:
- SQL & PL/SQL (Stored Functions, Stored Procedures, Indexes)
- Python
- Spark (PySpark, Spark SQL)
Azure Services: A Must for Data Engineers:
- Azure Data Factory
- Azure Databricks
- Azure Synapse
- Azure Storage
- Azure Data Lake
- Azure Blob Storage
- Azure Data Lake Storage
- Azure Cosmos DB
- Azure Logic Apps
- Azure Machine Learning
- Azure API Management
- Azure Event Hub
- Azure IoT Hub
PowerBI Services: A Must for BI Developers:
- PowerBI Desktop:
- Data Loading & Transformation (Power Query)
- Data Modeling
- Data Visualization
- DAX
- Report Design & Publishing
- Power BI Admin:
- Power BI Workspaces & Collaboration
- Data Refresh & Gateways
- Row-Level Security (RLS)
- Monitoring & Usage Analytics
- Licensing & Permissions
End- To-End Projects (At least 2)
- Data Ingestion End-to-End Pipeline and Visualization: Using Azure Storage (e.g., Azure SQL): The final table/files created by the Data Engineer will serve as the source for Power BI.
- Data Ingestion End-to-End Pipeline and Visualization: Using File Storage and Synapse Views: The final table/files created by the Data Engineer will serve as the source for Power BI.