Learning Format
Online Mode
Total Training Duration
200 Hrs
Duration
4 Month
Certification
Yes
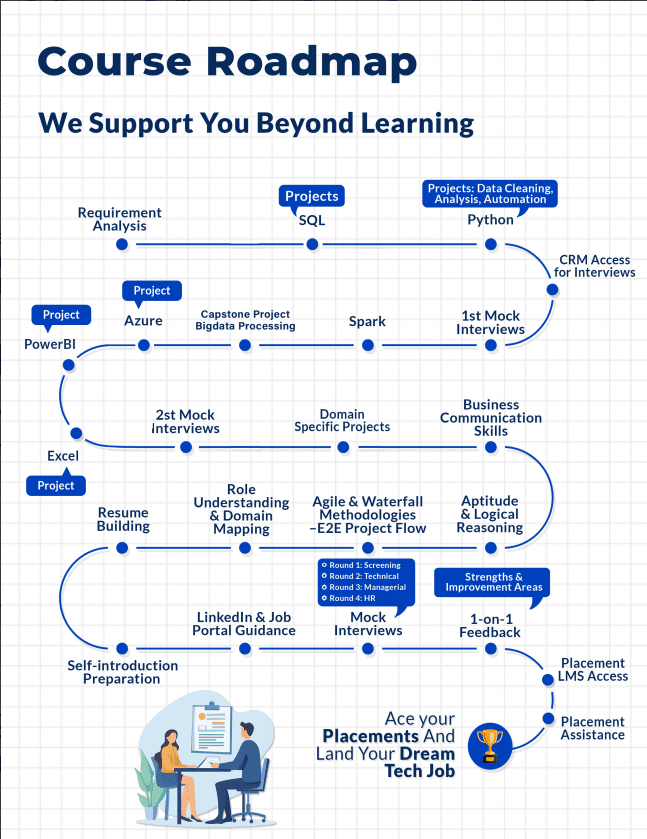
Power BI Course in PCMC Pune – Master Data Analytics with Practical Skills
Introduction to Power BI and Business Intelligence
In today’s data-driven world, the ability to analyze, visualize, and interpret data is a crucial skill for any aspiring professional. Businesses across industries rely on accurate data insights to make strategic decisions, improve efficiency, and gain a competitive edge. Our Power BI course in PCMC Pune is carefully designed to provide students and IT professionals with hands-on, practical expertise in business intelligence and data analytics. The course covers the entire workflow, from connecting and shaping data to designing advanced dashboards, as well as implementing security measures for enterprise-grade reporting. You will learn how to transform raw data into meaningful insights, identify trends and patterns, and present information in a clear, visually compelling manner. With a focus on real-world applications, this course prepares you to meet the growing demand for skilled data professionals in today’s competitive job market. By combining theoretical understanding with practical exercises, you will gain the confidence to deliver actionable insights and make data-driven decisions that drive business success.

The course begins with a clear introduction to business intelligence and Power BI. You will understand why businesses adopt BI tools, the key insights they provide, and how to select the right BI solution for your career or organization. We also guide you step-by-step on downloading and installing Power BI Desktop so you can get started immediately.
Next, you will dive into connecting and shaping data. Learn essential Power BI settings, the desktop interface, and the difference between front-end and back-end operations. You will work with data connectors, the Power Query Editor, and explore how to extract data from databases or web sources. This section also teaches data cleaning, formatting, and transformation, including handling numerical data, dates, times, and dynamic calendars. You will gain hands-on experience with grouping, aggregating, pivoting, merging queries, and managing parameters for different data sources.
Creating a data model is a core part of the course. You will learn about database normalization, table relationships, and connecting multiple fact tables. Topics include primary and foreign keys, active and inactive relationships, and understanding cardinality. We also cover optimizing your data model with filter context, bidirectional filters, hierarchies, and model layouts to improve report performance and usability.
Adding calculated fields using DAX is another critical skill. From basic calculated columns to advanced measures, you will explore functions such as mathematical, statistical, logical, and text operations. Time intelligence functions, implicit and explicit measures, and managing relationships in DAX are thoroughly explained. You will also learn debugging, evaluating variables, and handling large datasets efficiently in Power BI.
Visualizing data with reports is where your insights come to life. You will explore charts, KPI cards, tables, and matrix visuals. Learn advanced formatting, slicers, drill-through, bookmarks, and tooltips to create interactive, user-friendly dashboards. The course also emphasizes report optimization, performance analysis, and row-level security implementation to ensure enterprise-ready solutions.
Finally, you will gain practical experience with Power BI Service. Learn how to manage workspaces, collaborate with teams, publish apps, schedule data refreshes, and explore different license types. This hands-on approach ensures you can apply your skills to real-world scenarios and deliver actionable insights for business decision-making.
This Power BI course is offered under our Advanced Data Analytics Course in PCMC Pune, providing a complete learning experience for students aiming to become skilled data analysts. By the end of the course, you will be confident in building robust dashboards, performing complex data modeling, and applying analytics to solve business problems effectively.
Course Summary
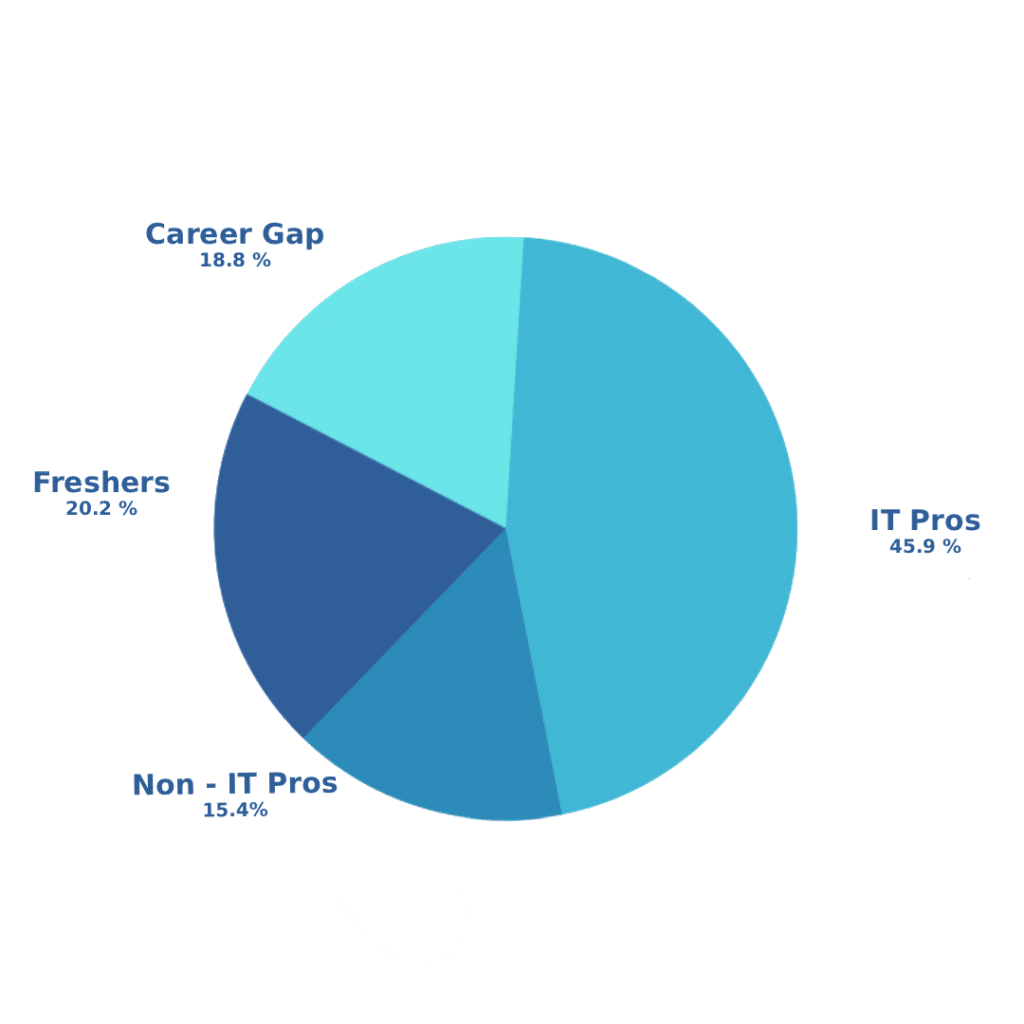
Eligibility
Tech & Non-Tech Working professional, Freshers, Graduate from any domain.
Real time projects
Gain hands-on experience through projects that simulate real-world challenges, preparing you for a career in analytics.
Dedicated Profile Building
Along with learning, we help you with ATS resume building and LinkedIn profile optimization
Hands-on Industry Relevant Casestudies
Complete guidance for 25+ Assignments and case studies to help you gain the hands-on experience.
Live Doubt Solving
Get your queries solved with daily dedicated doubts solving sessions.
800+ Companies
Connect with top employers
Certification
10+ ISO Globally recognized certified
LMS Access for 2 Years
Get course recording access for 2 years after course completion.
Aspirational peer group
10K+ students & alumni across diverse domains. Dedicated Telegram virtual classroom for peer-to-peer support.
Instructor
Experts and trainer for top-tech companies.
Direct CRM Calls
Get shortlisted instantly
GitHub Enhancement
Showcase coding skills
Al Mock
Interviews Practice and improve with Al feedback
Placement Assistance Until Placed
Along with up skilling and preparing you for the job, we also help you for your search & your interview.
Mode of Learning
100% Live Learning Learn directly from experienced instructors in Live sessions, with an emphasis on practical, hands-on learning.
Program Name
LinkedIn Optimization
Program Duration
Eligibility
Real time projects
Dedicated Profile Building
Live Doubt Solving
800+ Companies
Certification
LMS Access for 2 Years
Aspirational peer group
Hands-on Industry Relevant Casestudies
Instructor
Direct CRM Calls
GitHub Enhancement
Al Mock Interviews
Mode of Learning
Placement Assistance Until Placed
Syllabus Summary
A Comprehensive Curriculum Designed for Real-World Success
- Type of Statements, Constraints, Clauses
- Functions, Joins, Subqueries, Set Operators
- Analytical Functions, Pivot/Unpivot, Partitions
- Indexes, Views, Sequences, Synonyms
- Performance Tuning
- Stored Procedure & Stored Function
- Cursors, Exception Handling
- Introduction, Data Types (Tuple, List, Dict, Set)
- Control Statements, User-Defined Functions
- String Operations, File & Error Handling
- NumPy, Pandas
- Visualization: Matplotlib, Seaborn
- Automation & Real-World Cases
- Spark Overview
- Spark Architecture
- Transformations, Actions & Lazy Evaluation
- Series & DataFrame Basics
- Spark SQL
- DataFrame Operations
Filtering & Sorting
Built-in Functions & Case Statements
Aggregations & Grouping
Joins & Window Functions
Set Operators
GlobalTemp Views
Analytic Functions
Reading File Formats
Parquet, CSV, JSON
Nested DataFrames - SCD Type 1 (Slowly Changing Dimension)
- SCD Type 2
- Data Factory, Databricks, Synapse
- Storage, Data Lake, Blob Storage, Lake Storage
- Cosmos DB, Logic Apps, API Management
- Event Hub, loT Hub
- Data visualization using Power BI
- Data Modelling
- Power Query
- Advanced visualizations
- DAX
- Build data analytics project using Power BI
- Basics & Navigation
- Formulas & Functions
- Data Management
- Charts & Visualization
- Advanced Analysis
- Profile Management with GitHub
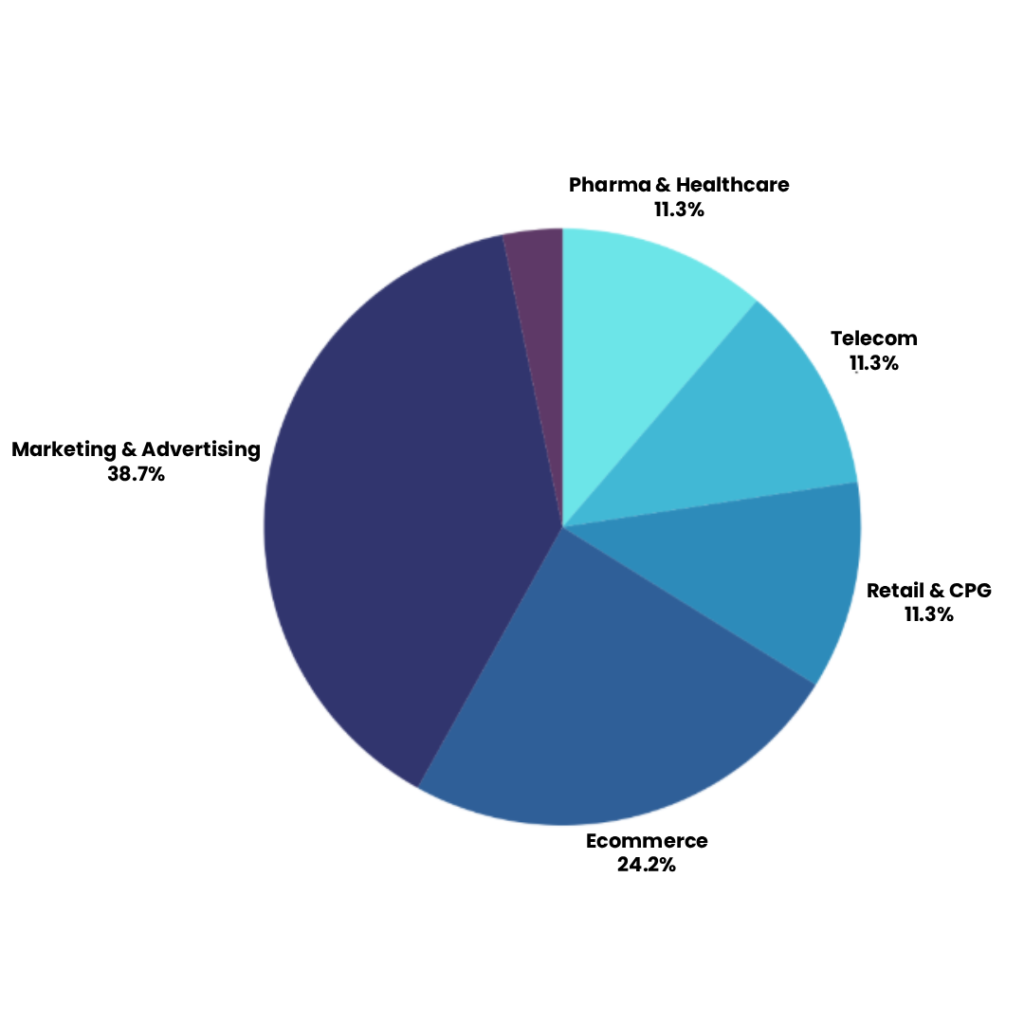
Top Hiring Industries in India for Data Analytics
Career Support Services
Resume Building
Linkedin Optimaztion
Access To Job Board
Interview Calls
GitHub Portfolio
IntelliBI Azure Data Engineering Certification
Course Highlights

- Course Duration
- 250+ Hours /
- 4 Months

-Pre-Class-
-Pre Career Counseling,
-Technical Evaluation

-Sessions- Technical,
-Softskill, Mentor,
-E-Consultation.

-Technical
-Assignments
-300+ Case Studies

-Industry Real
-World Project 4

-Mock Interviews 5

-Student Internship
-Dashboard

-Resume Preparation,
-Interview Guidance
-Job Readiness,
-Placement support
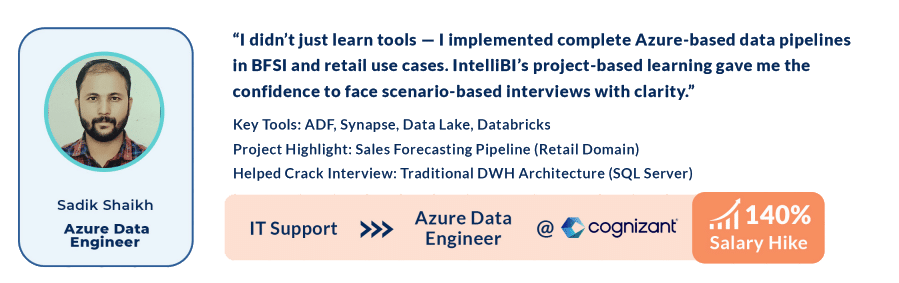
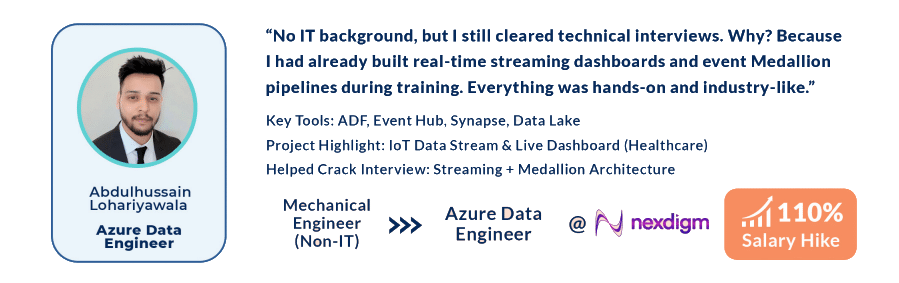
Our Learners Got Assured Placement. So Can You!
Students reviews
Real stories. Real success.
Real students.
[trustindex no-registration=google]
- Why Data Analyst
- Curriculum
1. Why Learning Advanced Data Analyst with Azure & with PowerBI is a Long-Term Investment:
2. Pre-requisites:
- SQL & PL/SQL (Stored Functions, Stored Procedures, Indexes)
- Python
- Spark (PySpark, Spark SQL)
3. Azure Services: A Must for Data Engineers:
- Azure Data Factory
- Azure Databricks
- Azure Synapse
- Azure Storage
- Azure Data Lake
- Azure Blob Storage
- Azure Data Lake Storage
- Azure Cosmos DB
- Azure Logic Apps
- Azure Machine Learning
- Azure API Management
- Azure Event Hub
- Azure IoT Hub
4. PowerBI Services: A Must for BI Developer:
- Power BI Desktop:
- Data Loading & Transformation (Power Query)
- Data Modeling
- Data Visualization
- DAX
- Report Design & Publishing
- Power BI Admin:
- Power BI Workspaces & Collaboration
- Data Refresh & Gateways
- Row-Level Security (RLS)
- Monitoring & Usage Analytics
- Licensing & Permissions
- Data Ingestion End-to-End Pipeline and Visualization: Using Azure Storage (e.g., Azure SQL): The final table/files created by the Data Engineer will serve as the source for Power BI.
- Data Ingestion End-to-End Pipeline and Visualization: Using File Storage and Synapse Views: The final table/files created by the Data Engineer will serve as the source for Power BI.
5. Comparing Coding Complexity: Advance Data Analysts vs Java Developers
6. Career Opportunities
- For Experienced Professionals:
- Azure Data Engineer
- Cloud Data Engineer
- Big Data Engineer
- Data Analyst
- Business Intelligence (BI) Developer
- Cloud Solutions Architect
- Data Analyst
- Azure Data Engineer + Power BI Specialist
- Power BI Developer
- Cloud ETL Developer
- For Freshers:
- SQL Developer
- PLSQL Developer
- Python Developer
- Pyspark developer
- Big Data Engineer
- Azure Data Engineer
- Cloud Data Engineer
- Data Analyst
- Azure Data Engineer + Power BI Specialist
- Business Intelligence(BI) Developer
- PowerBI Developer
- Cloud ETL Developer
7. Job Opening:
8. Eligibility Criteria:
- Eligible Degrees:
- BE (all streams)
- B.Tech
- BCS
- BCA
- B.Com
- BBA
- Other related technical or non-technical bachelor’s fields
- And its relevant postgraduate degrees
- Diploma Holders:
- All streams may also be eligible.
- Communication Skills:
- Basic written and verbal communication skills.
- Ability to explain technical concepts clearly.
9. The Future of Data Engineering with Azure:
10. Annual CTC for Data Analysts With Azure and Power BI. (Based on Experience):
- 0-1 Year Experience (Entry-Level):
- India: ₹4–6 LPA
- US: $60,000–$80,000
- 1-4 Years Experience (Junior/Mid-Level):
- India: ₹6–14 LPA
- US: $80,000–$110,000
- 4-8 Years Experience (Mid-Level/Senior):
- India: ₹10–25 LPA
- US: $110,000–$140,000
- 4.8+ Years Experience (Senior/Lead):
- India: ₹20–55+ LPA
- US: $140,000–$160,000+
Summary:
Pre-requisites:
- SQL & PL/SQL (Stored Functions, Stored Procedures, Indexes)
- Python
- Spark (PySpark, Spark SQL)
Azure Services: A Must for Data Engineers:
- Azure Data Factory
- Azure Databricks
- Azure Synapse
- Azure Storage
- Azure Data Lake
- Azure Blob Storage
- Azure Data Lake Storage
- Azure Cosmos DB
- Azure Logic Apps
- Azure Machine Learning
- Azure API Management
- Azure Event Hub
- Azure IoT Hub
PowerBI Services: A Must for BI Developers:
- PowerBI Desktop:
- Data Loading & Transformation (Power Query)
- Data Modeling
- Data Visualization
- DAX
- Report Design & Publishing
- Power BI Admin:
- Power BI Workspaces & Collaboration
- Data Refresh & Gateways
- Row-Level Security (RLS)
- Monitoring & Usage Analytics
- Licensing & Permissions
End- To-End Projects (At least 2)
- Data Ingestion End-to-End Pipeline and Visualization: Using Azure Storage (e.g., Azure SQL): The final table/files created by the Data Engineer will serve as the source for Power BI.
- Data Ingestion End-to-End Pipeline and Visualization: Using File Storage and Synapse Views: The final table/files created by the Data Engineer will serve as the source for Power BI.
- Curriculum
- Why Us
COURSE CONTENT
Data Transformations :
- Introduction to Power BI Desktop
- Changing Locale
- Connecting to a Database
- Basic Transformations
- Managing Query Groups
- Splitting Columns, Changing Data Types, Working with Dates
- Removing and Reordering Columns
- Conditional Columns
- Merge Queries
- Query Dependency View
- Transforming Less Structured Data
- Query Parameters
Data Modelling :
- Managing Data Relationships
- Creating Calculated Columns
- Optimizing Models for Reporting
- Creating Calculated Measures
- Creating and Managing Hierarchies
- Using Calculated Tables
- Time Intelligence
- Include and Exclude features
- Grouping and Binning
Visualizing your Data :
- Introduction to charts: Pie, Tree map, Combo charts, Map Visualizations, Scatter plot, Table, Matrix, Gauge, Card, Shapes, Textboxes, Images and KPI
- Filter (Including TopN), Date Slicer
- Coloring Charts
- Page Layout, Positioning, Aligning, Sorting Visuals and Formatting
- Visual Relationship
- Custom Hierarchies
Working with PBI Service :
- Overview of Dashboards and Service
- Uploading to Power BI Service
- Configuring a Dashboard
- Dashboard Settings
- In-Focus Mode
- Pinning a Live Page
- Custom URL and Title
- Export to CSV and Excel
- Power BI Notifications
- Publishing to Web
Working with Excel :
- Importing Excel Data using Simple Table
- Connecting to Excel Workbook on OneDrive for Business
- Pinning Excel Tables or Visuals
Organization Packs, Security and Groups :
- Creating a Group
- Creating, Using and Editing a Content Pack
- Row Level Security
- Data Classification
- Creating and Using Custom Visuals
IntelliBI Innovations is a trusted training center in administrative and software development courses from past 7+ years. IntelliBi offers strategic preparing ways for the certification abilities to upgrade yourself in a better way. Your success is our aim. We center around offering you the best classrooms/ virtual experience alongside the best client assistance. our certification from our technology partners also extends to our facilities. Our devotion to your prosperity is reflected in our agreeable staff, eager teachers and dynamic homeroom setting and hardware.